PrintDURATION: 1 day |
| TIME: 09:00 to 16:00 GMT |
Turn messy spreadsheets into professional, refreshable reports in just one day. This hands-on Excel course shows you how to use Power Query to clean, combine and transform business data quickly and accurately, eliminating repetitive manual tasks. You'll learn how to create reliable reporting processes that update in seconds when new data arrives, then present insights using PivotTables, PivotCharts and interactive slicers. Working with a realistic UK business case study throughout the day, you'll solve common data challenges and build a complete reporting solution you can adapt to your own workplace. Leave with practical skills, greater confidence and significant time-saving techniques.

Every month the same export lands in your inbox: blank cells, names typed three different ways, dates stored as text and duplicate rows. Someone spends hours tidying it by hand, and next month they do it all again.
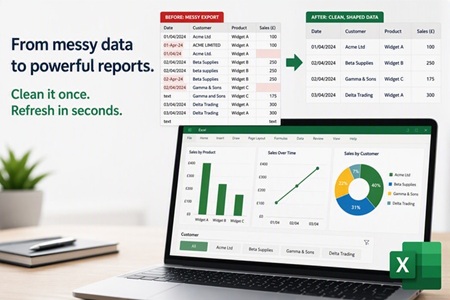
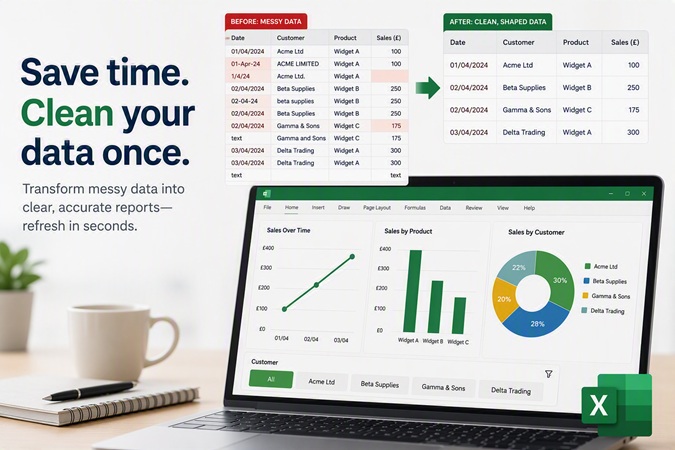
This practical one-day Excel data Analysis Reporting course teaches you to use the Power Query Editor in Microsoft Excel to clean, combine and reshape business data once, then refresh it in seconds whenever new data arrives. You then turn the clean output into clear, accurate reports with PivotTables, PivotCharts and slicers.
You learn by doing. Throughout the day you work on a realistic sales data set from a fictional UK wholesaler, fixing the kind of problems you meet in real company data, and you leave with a working, refreshable solution you can adapt for your own reports.
Power Query for data analysis reporting (shown in Excel as Get & Transform Data) connects to your data, cleans and reshapes it, and loads the result into Excel. It never changes your original data. Instead, it records each action as a step, like a recipe. When next month’s data arrives, you press Refresh and the whole recipe runs again.
This data analysis reporting course is for anyone who regularly receives data from another system and has to turn it into a report, for example:
No previous Power Query or data analysis reporting experience is needed. However, you should be comfortable with everyday Excel: moving between sheets, sorting and filtering, and writing simple formulas such as SUM. Knowing what an Excel Table is (Ctrl+T) is helpful but we cover it on the day.
You need Excel for Microsoft 365, or Excel 2024, 2021, 2019 or 2016, on a Windows computer. Power Query is also available in Excel for Mac and Excel for the web, but some menus differ from those used on the course. If you are unsure which version you have, contact us before booking and we will help you check.
By the end of the data analysis reporting course you will have built a complete, refreshable Power Query solution in your own copy of the practice file:
By the end of this course, you will be able to:
No. The Data Analysis Reporting course starts from the beginning. You should already be comfortable with everyday Excel tasks.
Power Query is available in Excel for Mac, but some menus and features differ from the Windows version we use. For the best experience, attend on a Windows PC with Excel for Microsoft 365 or Excel 2016 onwards.
No. Everything is done with menus and buttons. We show you the M code Power Query writes in the background so you know where to find it, but you do not need to write it.
The main exercises use the practice file so everyone can check their results. In the afternoon you plan a query for your own work. If you bring your own data, please remove or anonymise any personal or confidential information first.
You keep the workbook and practice file, so you can repeat the exercises and extension tasks. Your 30-day action plan helps you apply Power Query to a real report straight away.

Virtual classroom using Microsoft Teams: £1,900+VAT for up to 8 delegates
On-site: £1,999+VAT for up to 8 delegates (rates may differ if outside Hampshire, Dorset and Wiltshire)
